What Is Order Flow?
Order flow is the stream of executed trades and resting orders read with the aggressor side attached — which trades were aggressive buys and which were aggressive sells — describing how buying and selling actually transacted, not just the price that resulted.
How order flow works
Every trade has two sides, but only one aggressor: the participant who crossed the spread to make the trade happen. A market buy that lifts the resting offer is aggressive buying; a market sell that hits the resting bid is aggressive selling. Order-flow analysis tags each executed trade with its aggressor side and reads the running balance between the two.
Layered on top is the order book — the resting limit orders waiting at each price. Order flow is the interaction between the two: aggressive market orders consuming, or failing to consume, the passive liquidity in the book.
Order flow vs a candlestick chart
A candlestick and order flow describe the same market, but at very different depth.
| Candlestick | Order flow | |
|---|---|---|
| What it shows | Open, high, low, close per bar | Individual trades with aggressor side, plus resting liquidity |
| Answers | Where did price go? | Who was aggressive, and where did volume transact? |
| Resolution | Four numbers per bar | Trade-by-trade and level-by-level |
| Best for | Trend and structure at a glance | Absorption, imbalance and exhaustion reading |
Why bid/ask volume matters
Raw volume tells you how much traded; the bid/ask split tells you who traded it. That distinction is what makes order flow more than a volume histogram:
Reading aggressor-side volume helps you spot:
- Absorption — heavy aggressive selling that price refuses to follow, implying resting buyers are absorbing it.
- Imbalance — a price where one side's aggression far outweighs the other's.
- Exhaustion — aggression thinning at the extreme of a move.
These are descriptive readings of completed activity, not predictions about what price will do next.
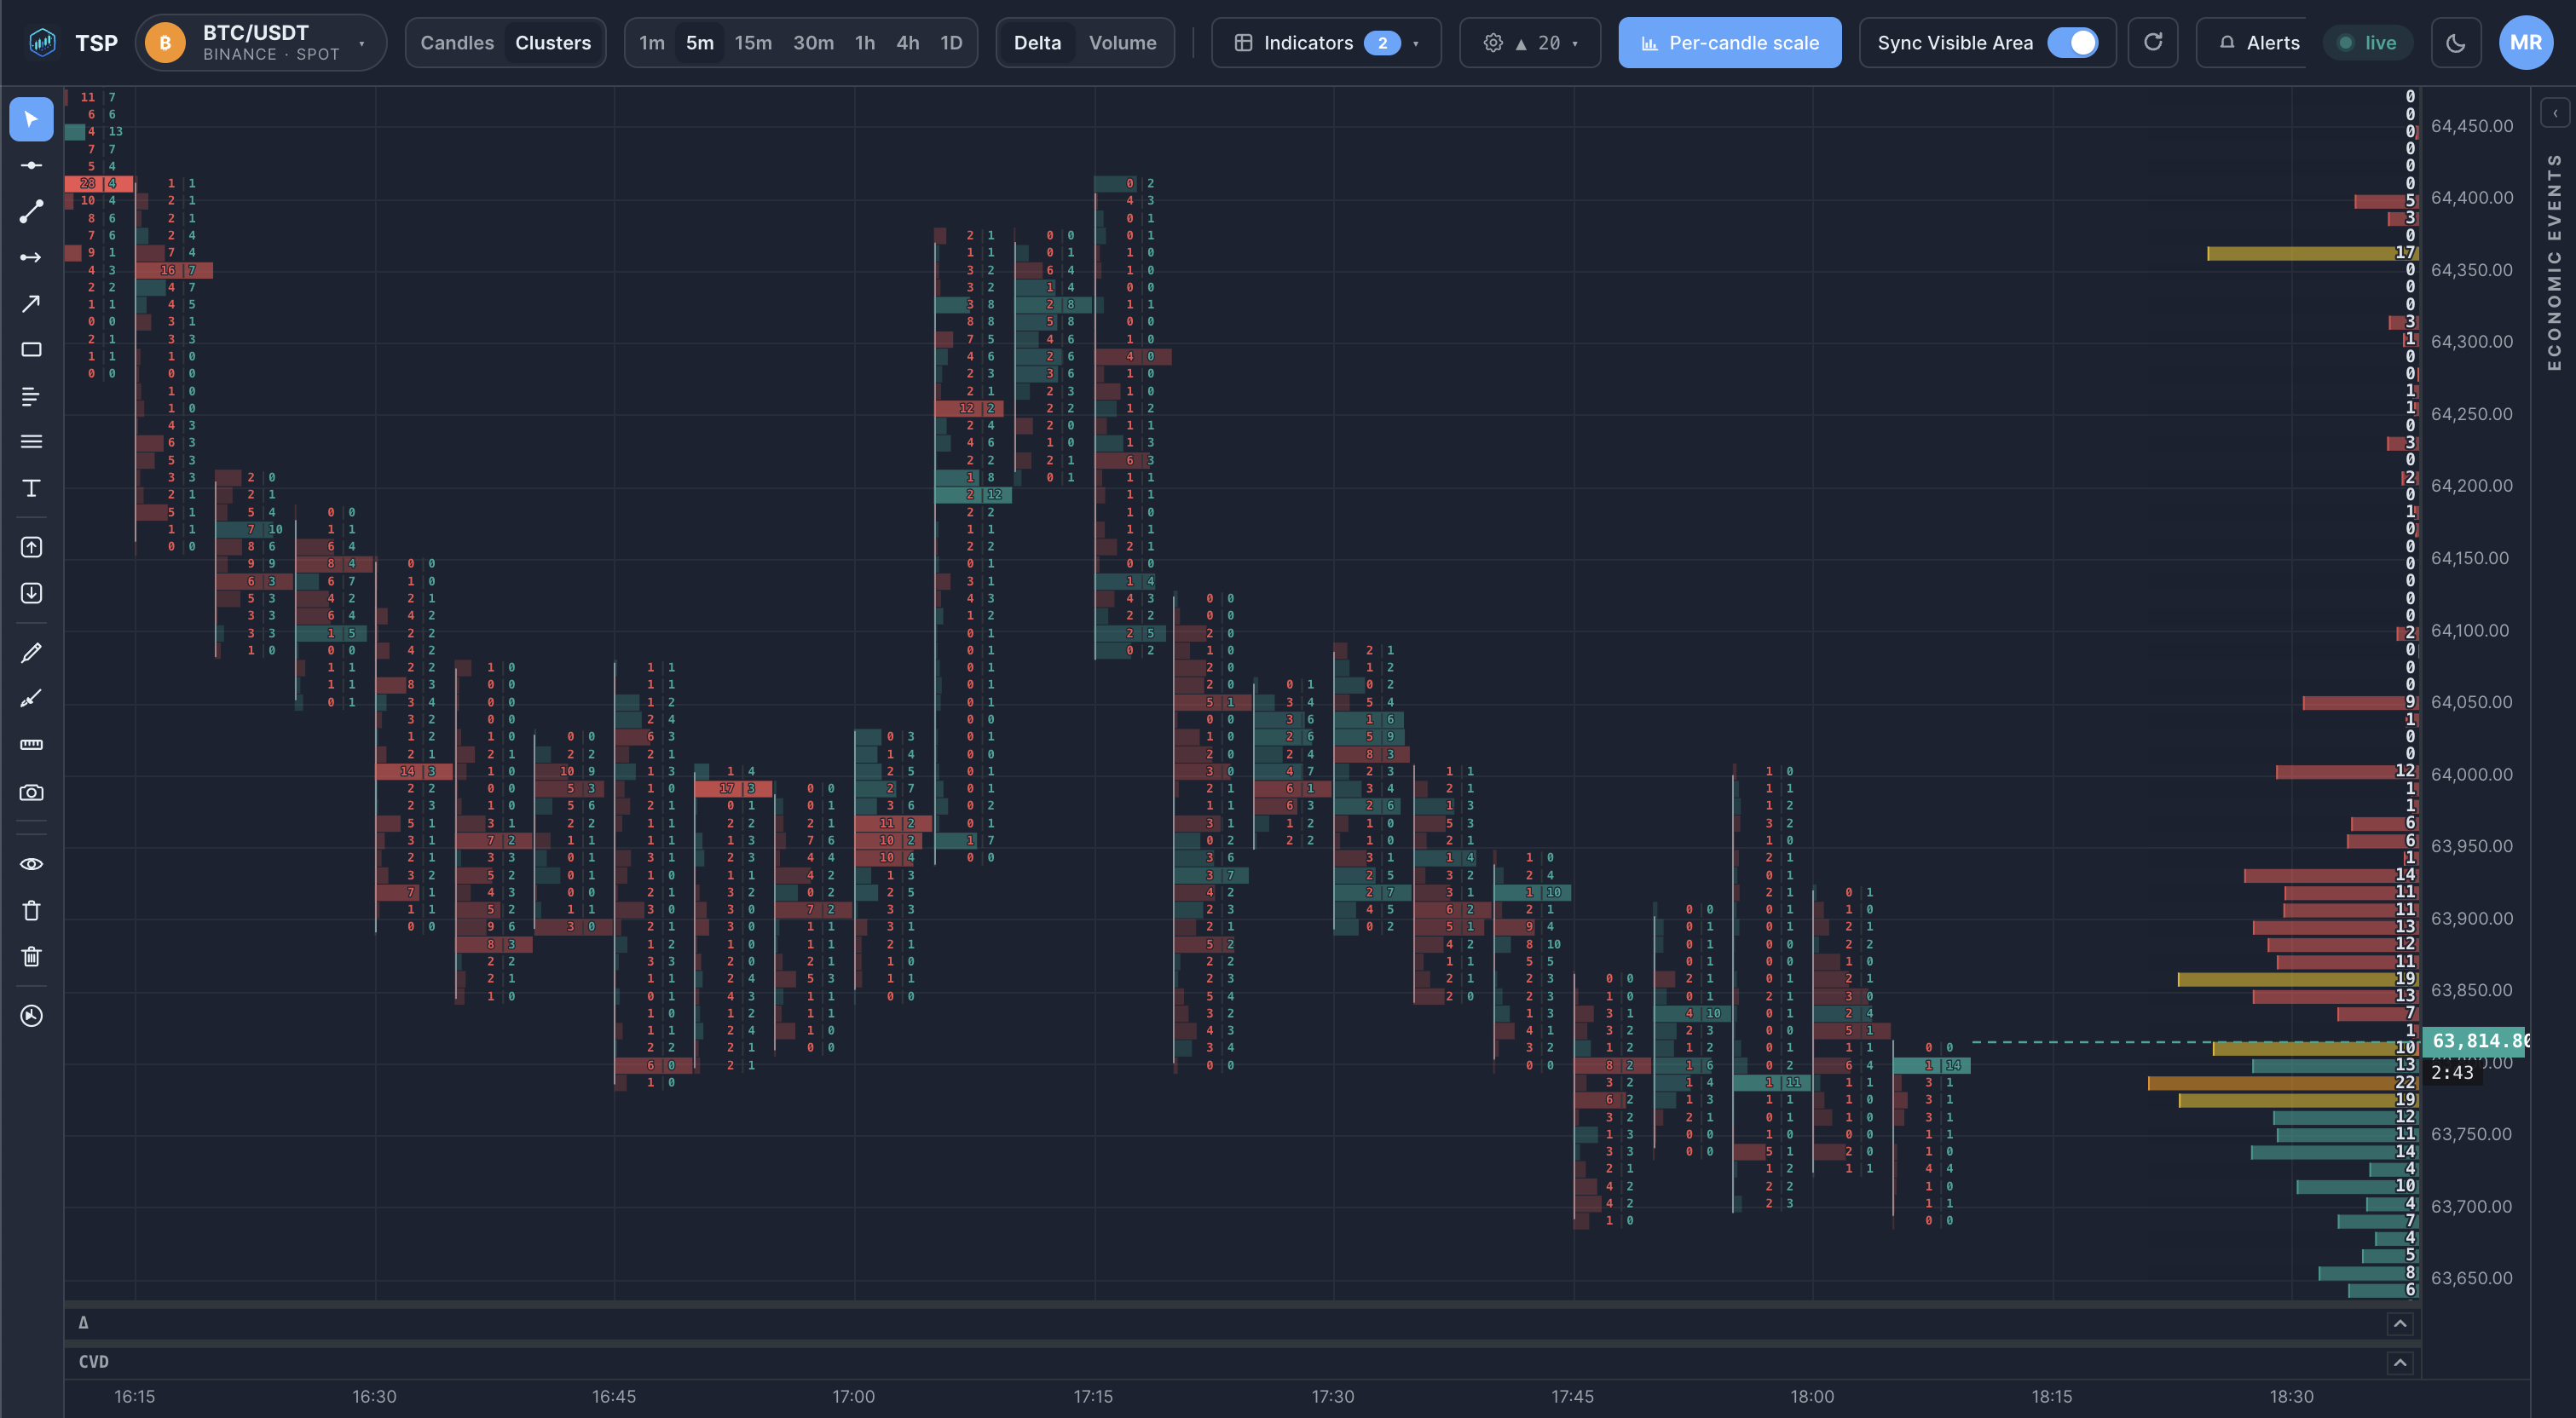
Example
FAQ
What is order flow?
Order flow is the stream of executed trades and resting orders, read with the aggressor side attached: which trades were aggressive buys lifting the offer and which were aggressive sells hitting the bid. It describes how buying and selling actually transacted, not just the price that resulted.
How is order flow different from a candlestick chart?
A candlestick summarizes a period into open, high, low and close. Order flow looks inside that period at the individual trades and the bid/ask split, showing who was aggressive and where, rather than only the range price covered.
What tools show order flow?
Footprint and cluster charts show order flow by price level inside each bar; delta and cumulative delta condense the bid/ask split into a signed value; the depth-of-market view shows the resting liquidity that order flow trades into.
Does order flow predict price?
No. Order flow describes aggression and liquidity that have already transacted. It is analytical context for self-directed analysis, not a signal or forecast.
Read order flow on live crypto data
Open the TSP Core dashboard and watch aggressive buying and selling transact in real time.