Order Flow
Order flow is the live sequence of executed trades and order-book changes — who was the aggressor, at what price, and in what size. It is the raw material that footprint, cluster, delta and volume views are all built from.
What is order flow?
Every price move is the result of orders meeting. A resting limit order sits in the book; a market order crosses the spread to fill against it. The party that crosses is the aggressor — an aggressive buyer lifts the offer, an aggressive seller hits the bid. Order flow is the running record of those executions, level by level, in the order they happened: the tape.
Because crypto exchanges publish every trade and order-book update, order flow can be reconstructed faithfully rather than estimated — making it a clean foundation for higher-level analytics.
Why does it matter?
Price alone tells you the result; order flow tells you the process. Reading it adds context that a candle cannot:
- Aggression — whether buyers or sellers were the ones crossing the spread to make price move.
- Participation — how much size actually changed hands behind a move, not just how far price travelled.
- Reaction — how resting liquidity responded when aggressive orders arrived.
These are descriptive observations of executed activity — context for self-directed analysis, not signals.
How traders use it
Order-flow reading is usually done close to real time, where the sequence of prints still carries information:
- Watching the tape speed up or slow down as price approaches a level.
- Noting whether a push higher is driven by genuine aggressive buying or by sellers simply stepping back.
- Using order flow as the input layer, then stepping up to footprint or delta views to summarise it.
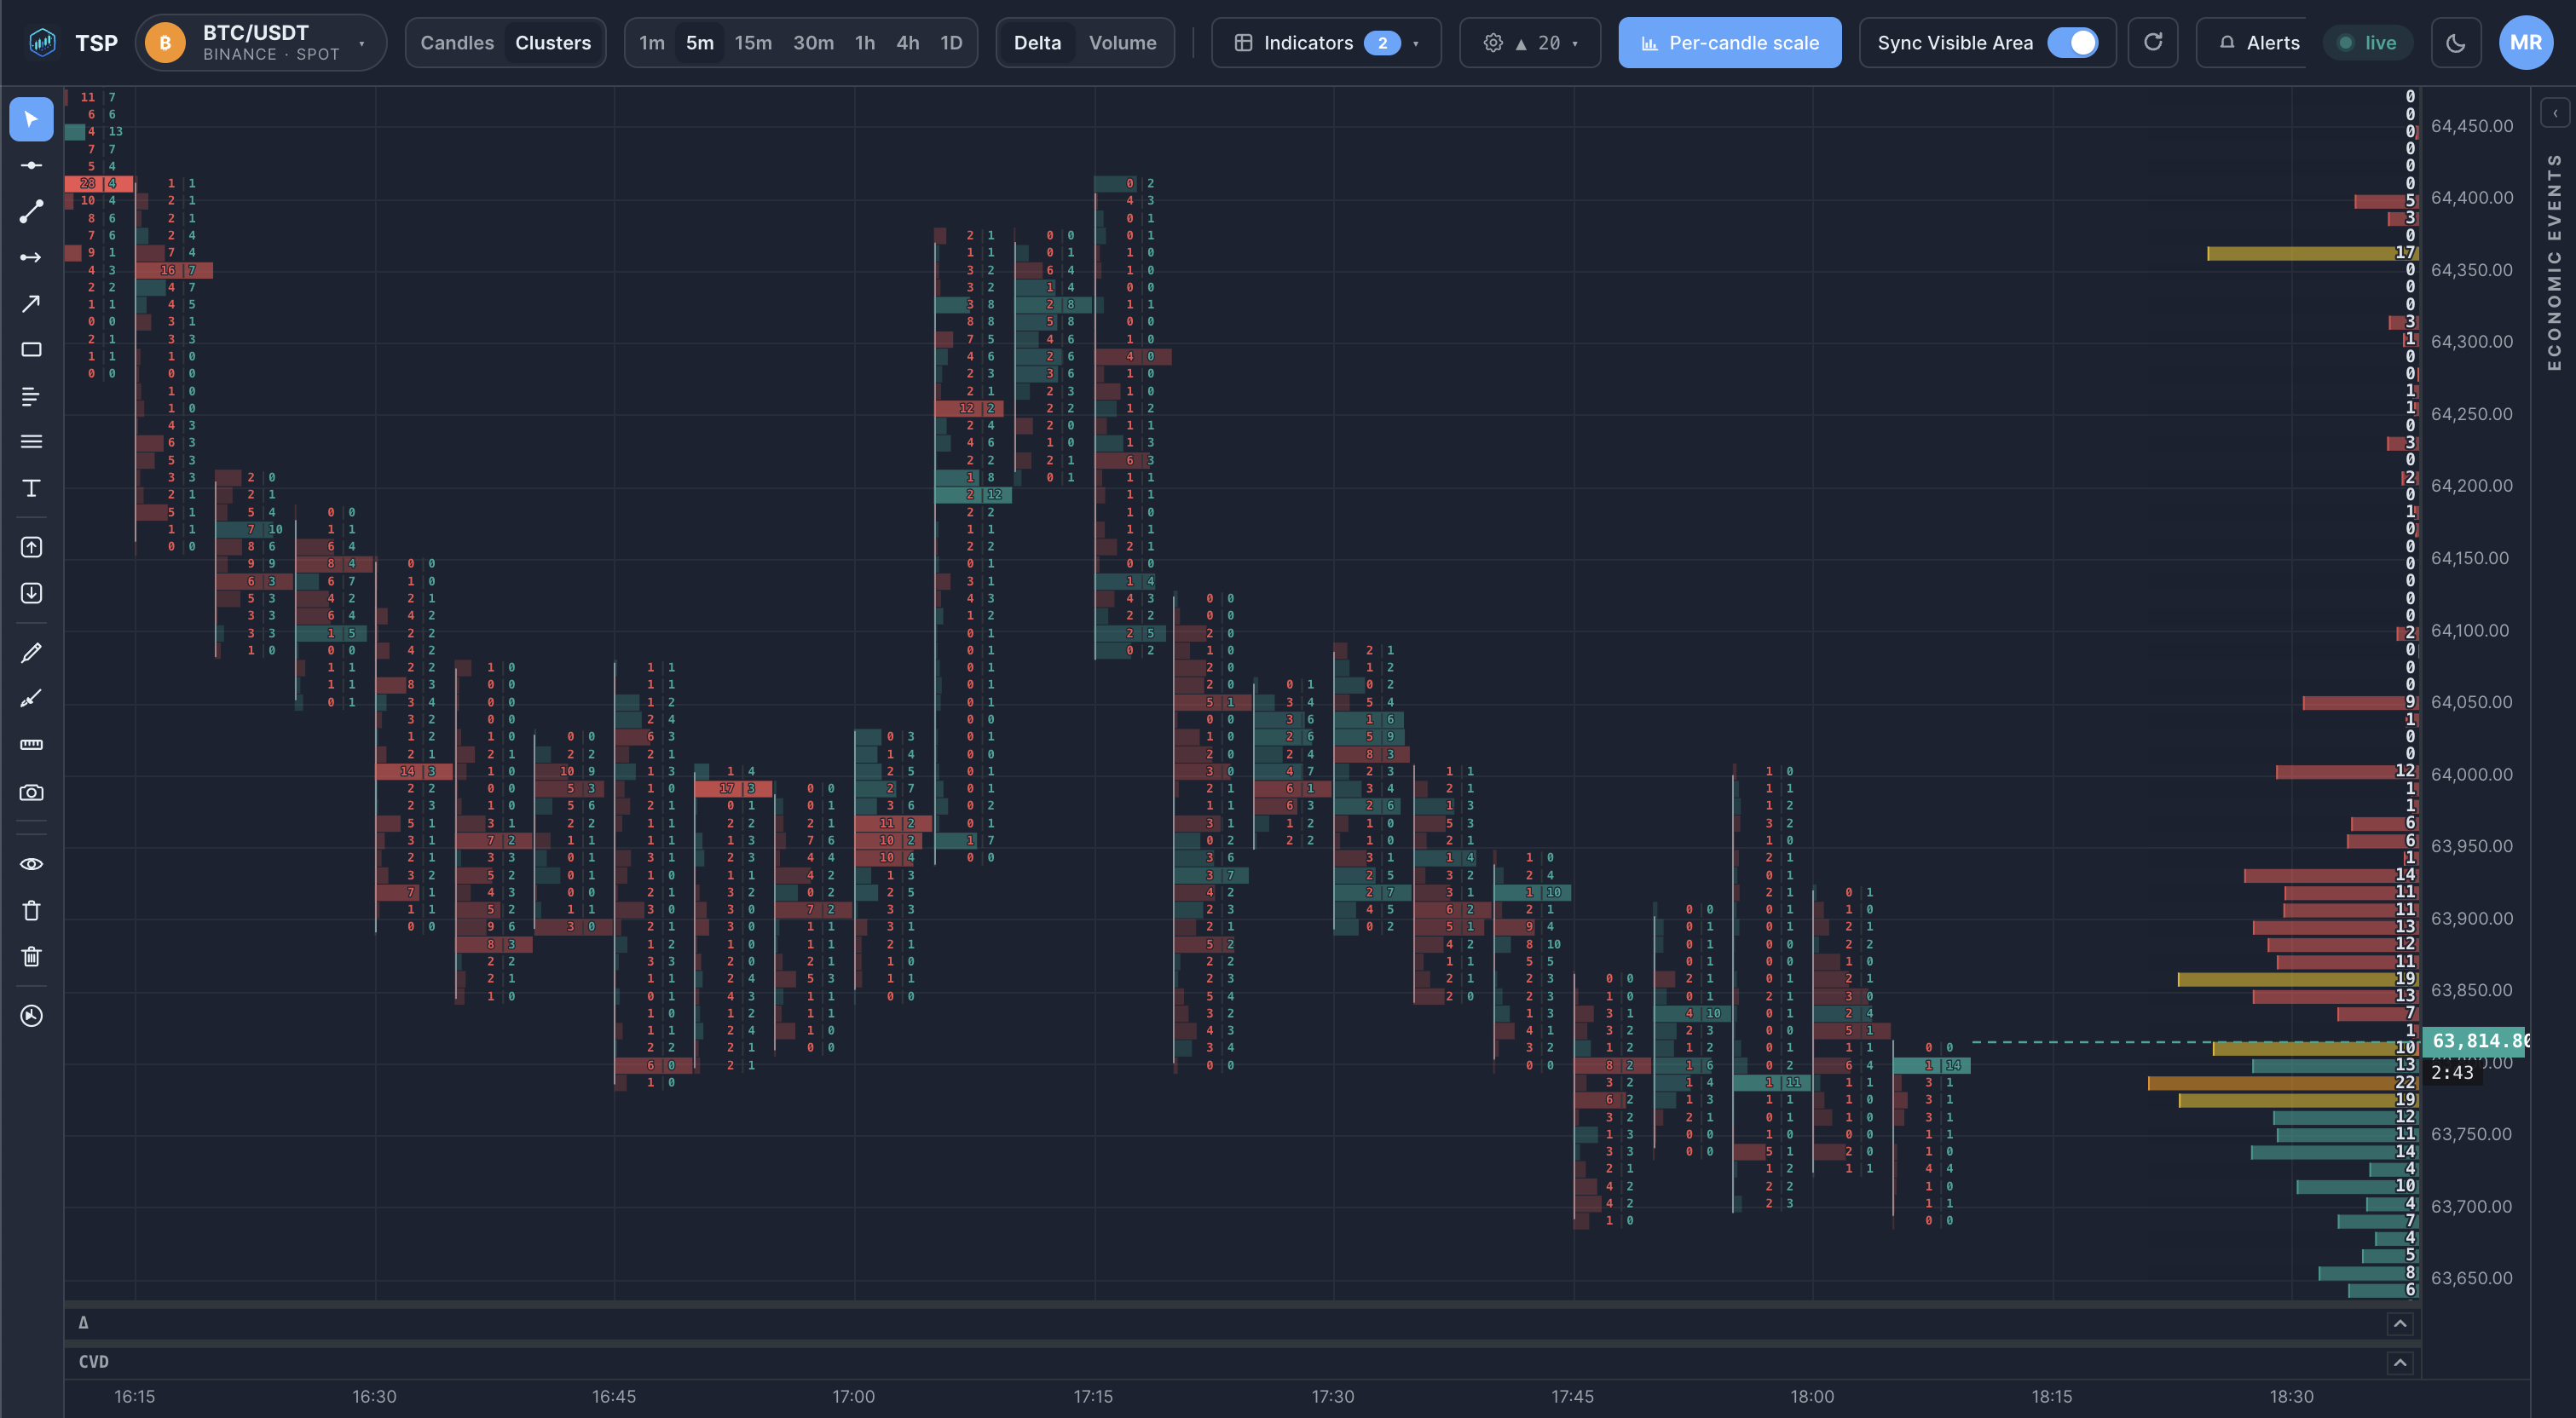
Example on a chart
Common mistakes
- Over-reading a single print. One large trade is noise until it fits a pattern; order flow is read as a sequence, not a headline.
- Forgetting the two sides of liquidity. Price can rise on heavy buying or on thin offers — the tape distinguishes them, the candle doesn't.
- Watching the tape on too high a timeframe. Order-flow nuance lives in the lower timeframes; on a daily bar it is already summarised away.
- Treating flow as prediction. It describes what just traded, which informs analysis but does not forecast the next move.
How TSP Core visualizes it
TSP Core streams live trades and order-book updates and turns them into connected views: the price chart, the footprint and cluster columns, delta and cumulative delta, and depth of market. Because they all draw on the same real-time order flow, the tape, the bars and the derived analytics stay consistent with one another as the market moves.
See live order flow on crypto markets
Open the TSP Core dashboard and read the tape alongside footprint, delta and DOM views.