What Is a Cluster Chart?
A cluster chart groups the volume traded inside each bar into price bands and shows the aggressive buy/sell split at every band — a footprint chart whose levels are aggregated into fixed-size price clusters for a cleaner read.
How cluster charts work
Each trade executes at a price and on a side: an aggressive buyer lifting the offer or an aggressive seller hitting the bid. A cluster chart takes those trades and bins them into price bands of a chosen size — say $50 or $150 wide — then tallies the buy and sell volume in each band within every bar. The bar becomes a stack of clusters, each annotated with how much traded there and which side was the aggressor.
Because the band size is configurable, you control the resolution: tighter bands expose fine detail, wider bands smooth a busy bar into a handful of readable clusters. The band size is a price increment, not a timeframe — it does not change how much time the bar covers.
Cluster chart vs footprint chart
A cluster chart and a footprint chart show the same order-flow data; they differ only in how finely price is grouped.
| Footprint | Cluster | |
|---|---|---|
| Price grouping | Can show every price level | Levels binned into fixed-size bands |
| Controlled by | The instrument's tick | A chosen band size (price increment) |
| Reads best | Fine, level-by-level detail | Heavy bars, at-a-glance distribution |
| Same data? | Yes — bid/ask volume by price, just at different resolution | |
Why bid/ask volume matters
Grouping by price is only half the value; the bid/ask split is the other half. Knowing a band traded 1,200 contracts tells you it was busy; knowing 1,000 of them were aggressive buys tells you who was busy. That is the heart of order-flow reading:
The split across clusters helps you spot:
- Absorption — heavy aggressive selling in a band that fails to push price lower.
- Imbalance — a band where one side's volume dwarfs the other's.
- Where business was done — the cluster that traded the most volume in the bar.
These are descriptive readings of completed activity, not predictions about what price will do next.
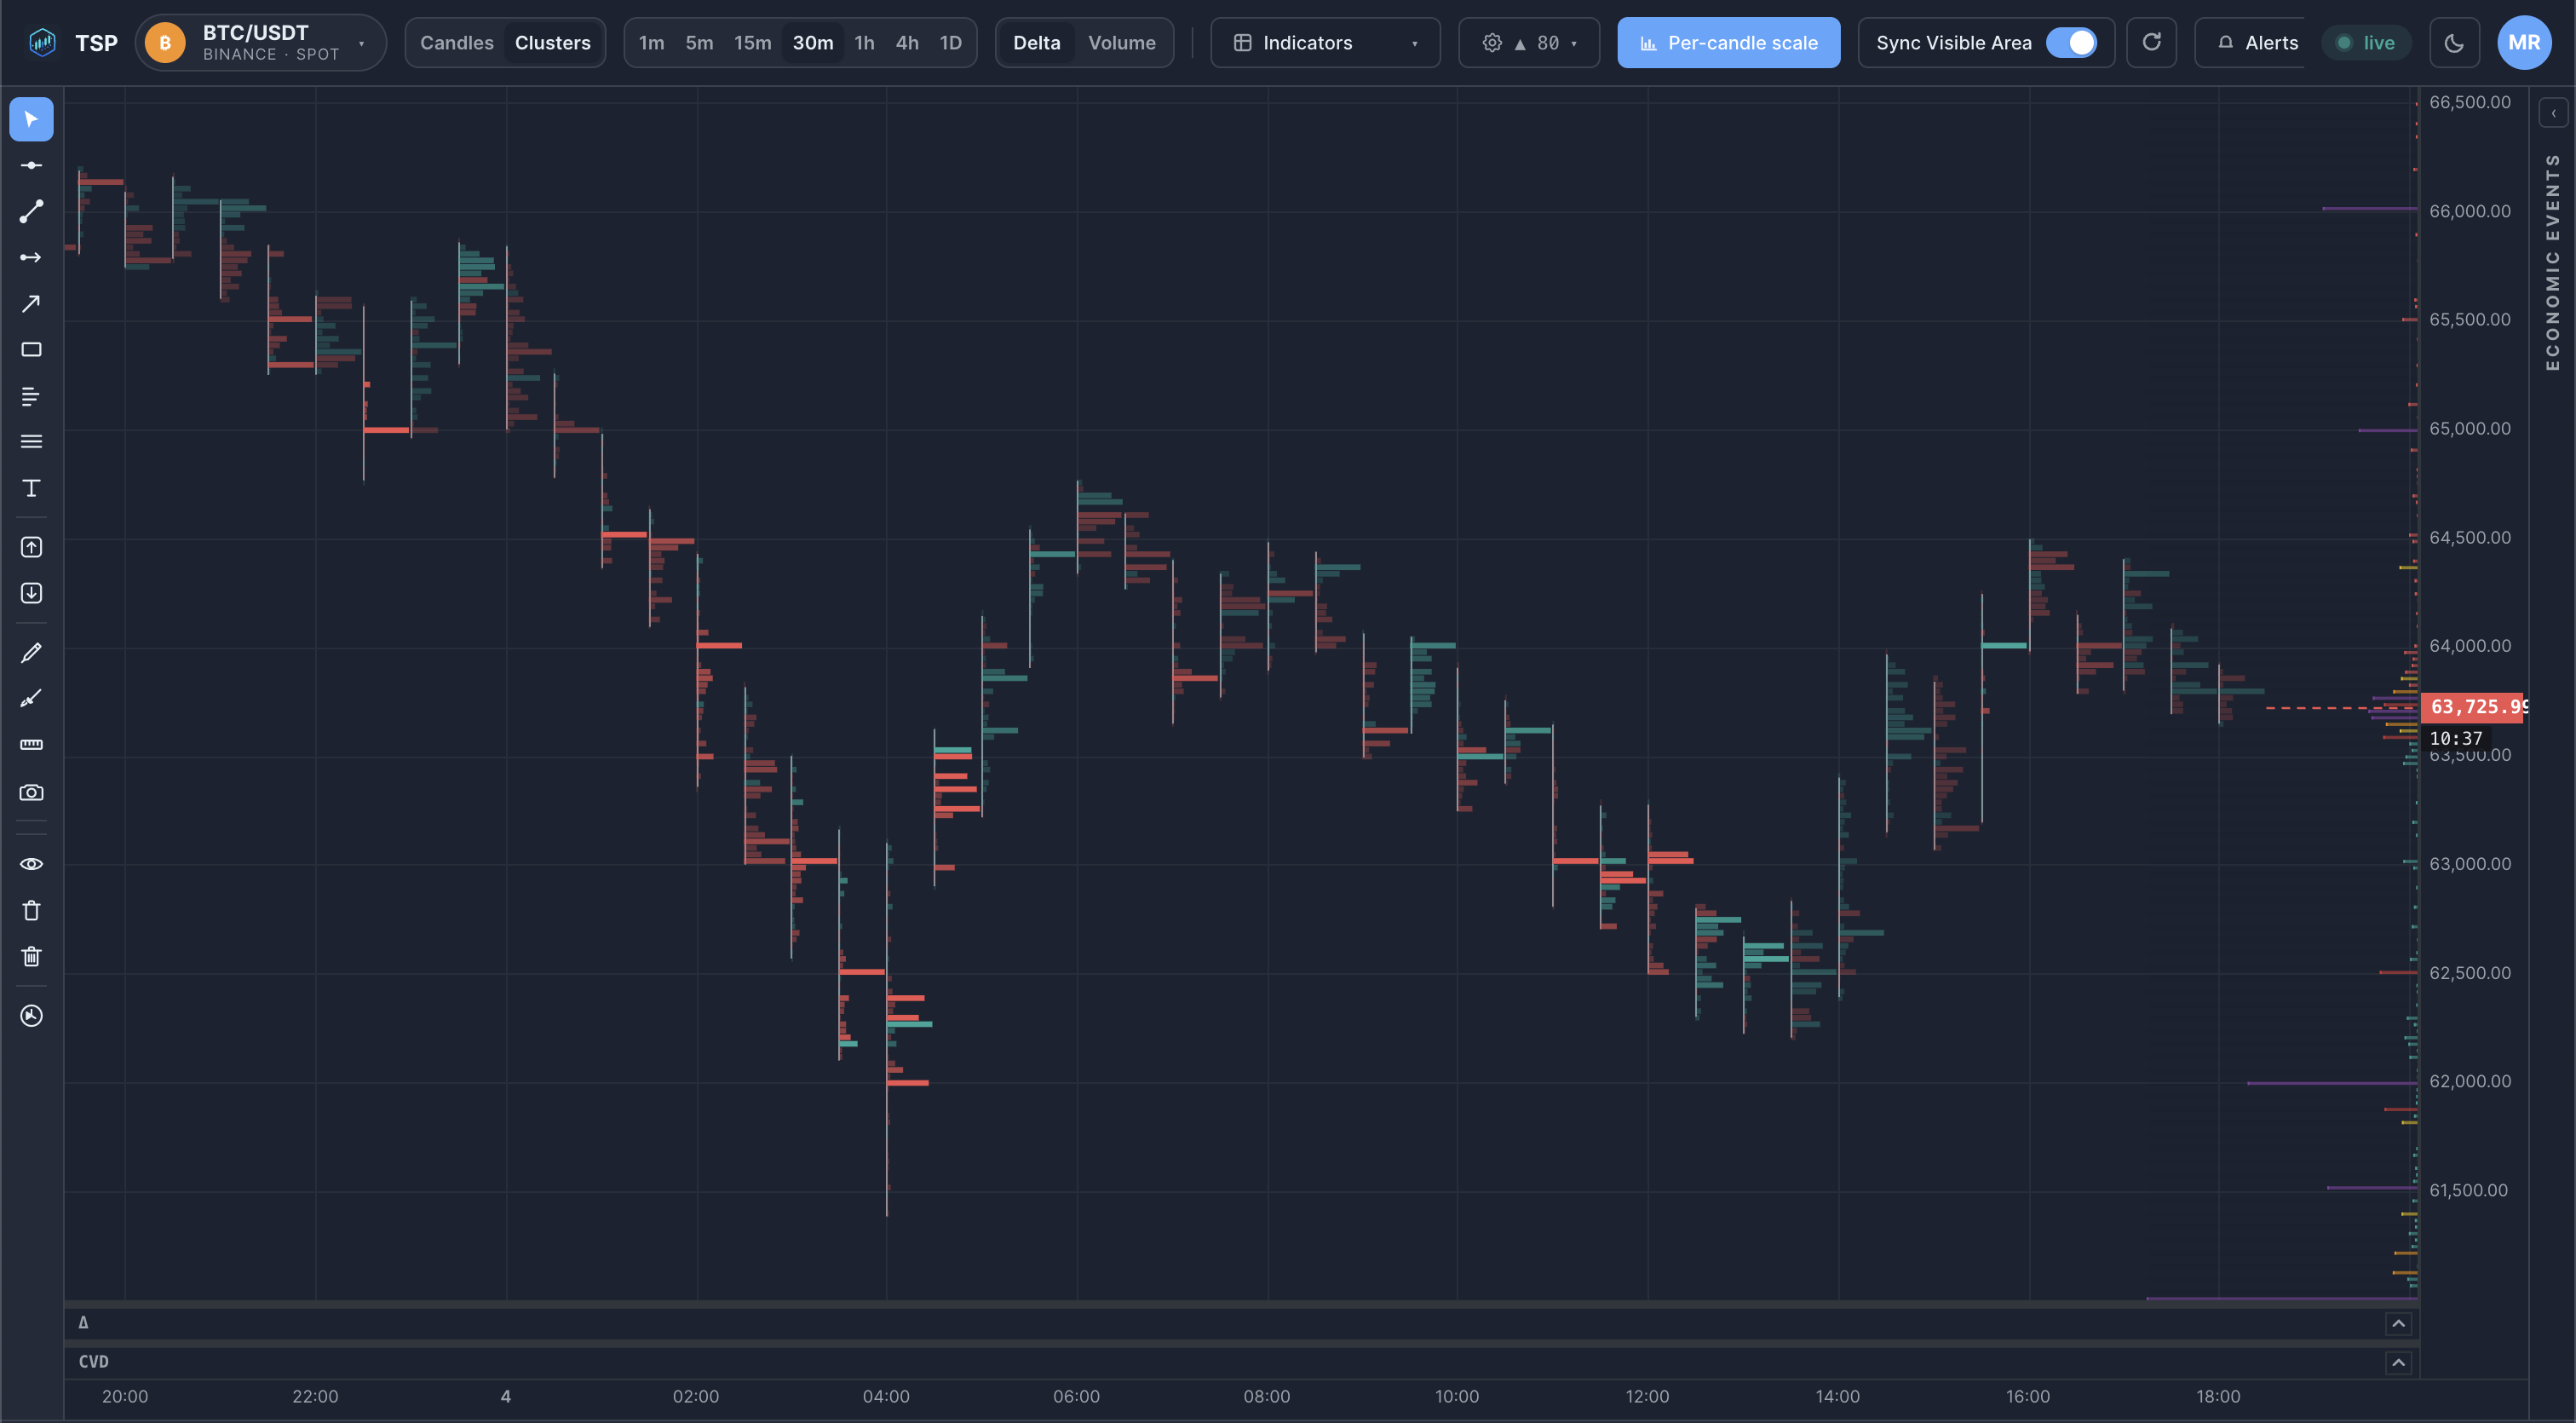
Example
FAQ
What is a cluster chart?
A cluster chart groups traded volume into price bands within each bar and shows the bid/ask split at every band. It is a footprint chart whose levels are aggregated into fixed-size price clusters rather than every individual tick.
How is a cluster chart different from a footprint chart?
They show the same order-flow data; the difference is granularity. A footprint chart can show every price level, while a cluster chart aggregates levels into price bands of a chosen size, making heavy bars easier to read at a glance.
Is the cluster band size a timeframe?
No. The cluster scale is a price increment, not a time interval. A larger band size groups more prices into each cluster; it does not change the time period the bar covers.
Do cluster charts predict price?
No. A cluster chart describes how volume was distributed across price in bars that have already traded. It is analytical context, not a signal or forecast.
Read clusters on live crypto data
Open the TSP Core dashboard and group order flow into price bands in real time.