Cumulative Delta (CVD)
Cumulative volume delta is a running total of delta over time. Where delta measures one bar's net aggressive volume, CVD adds each bar's delta to the last — drawing a line that shows how aggression has accumulated across a session.
What is cumulative delta?
Start at zero and, bar after bar, add positive delta when buyers were aggressive and subtract when sellers were. The result is a curve. A rising CVD line means aggressive buying has been accumulating; a falling line means aggressive selling has dominated. Because it is cumulative, CVD smooths the bar-to-bar noise of raw delta into a trend of participation.
CVD is usually anchored to a meaningful start — the session open, the day, or a chosen point — since the line's absolute value only has meaning relative to where the count began.
Why does it matter?
CVD is most useful read against price. The relationship between the two adds context:
- Confirmation — price and CVD rising together describes a move carried by accumulating aggressive buying.
- Divergence — price making a new high while CVD does not may reflect the move running on less aggressive buying than before.
- Absorption — CVD climbing while price stalls is a descriptive sign that resting sellers are absorbing the buying.
These are descriptive observations about accumulated activity — context for self-directed analysis, not predictions.
How traders use it
- Anchoring CVD to the session start and comparing whether it aligns with or diverges from price.
- Comparing the slope of CVD during a push higher against the following pullback.
- Using CVD as the over-time companion to per-bar delta and per-level footprint readings.
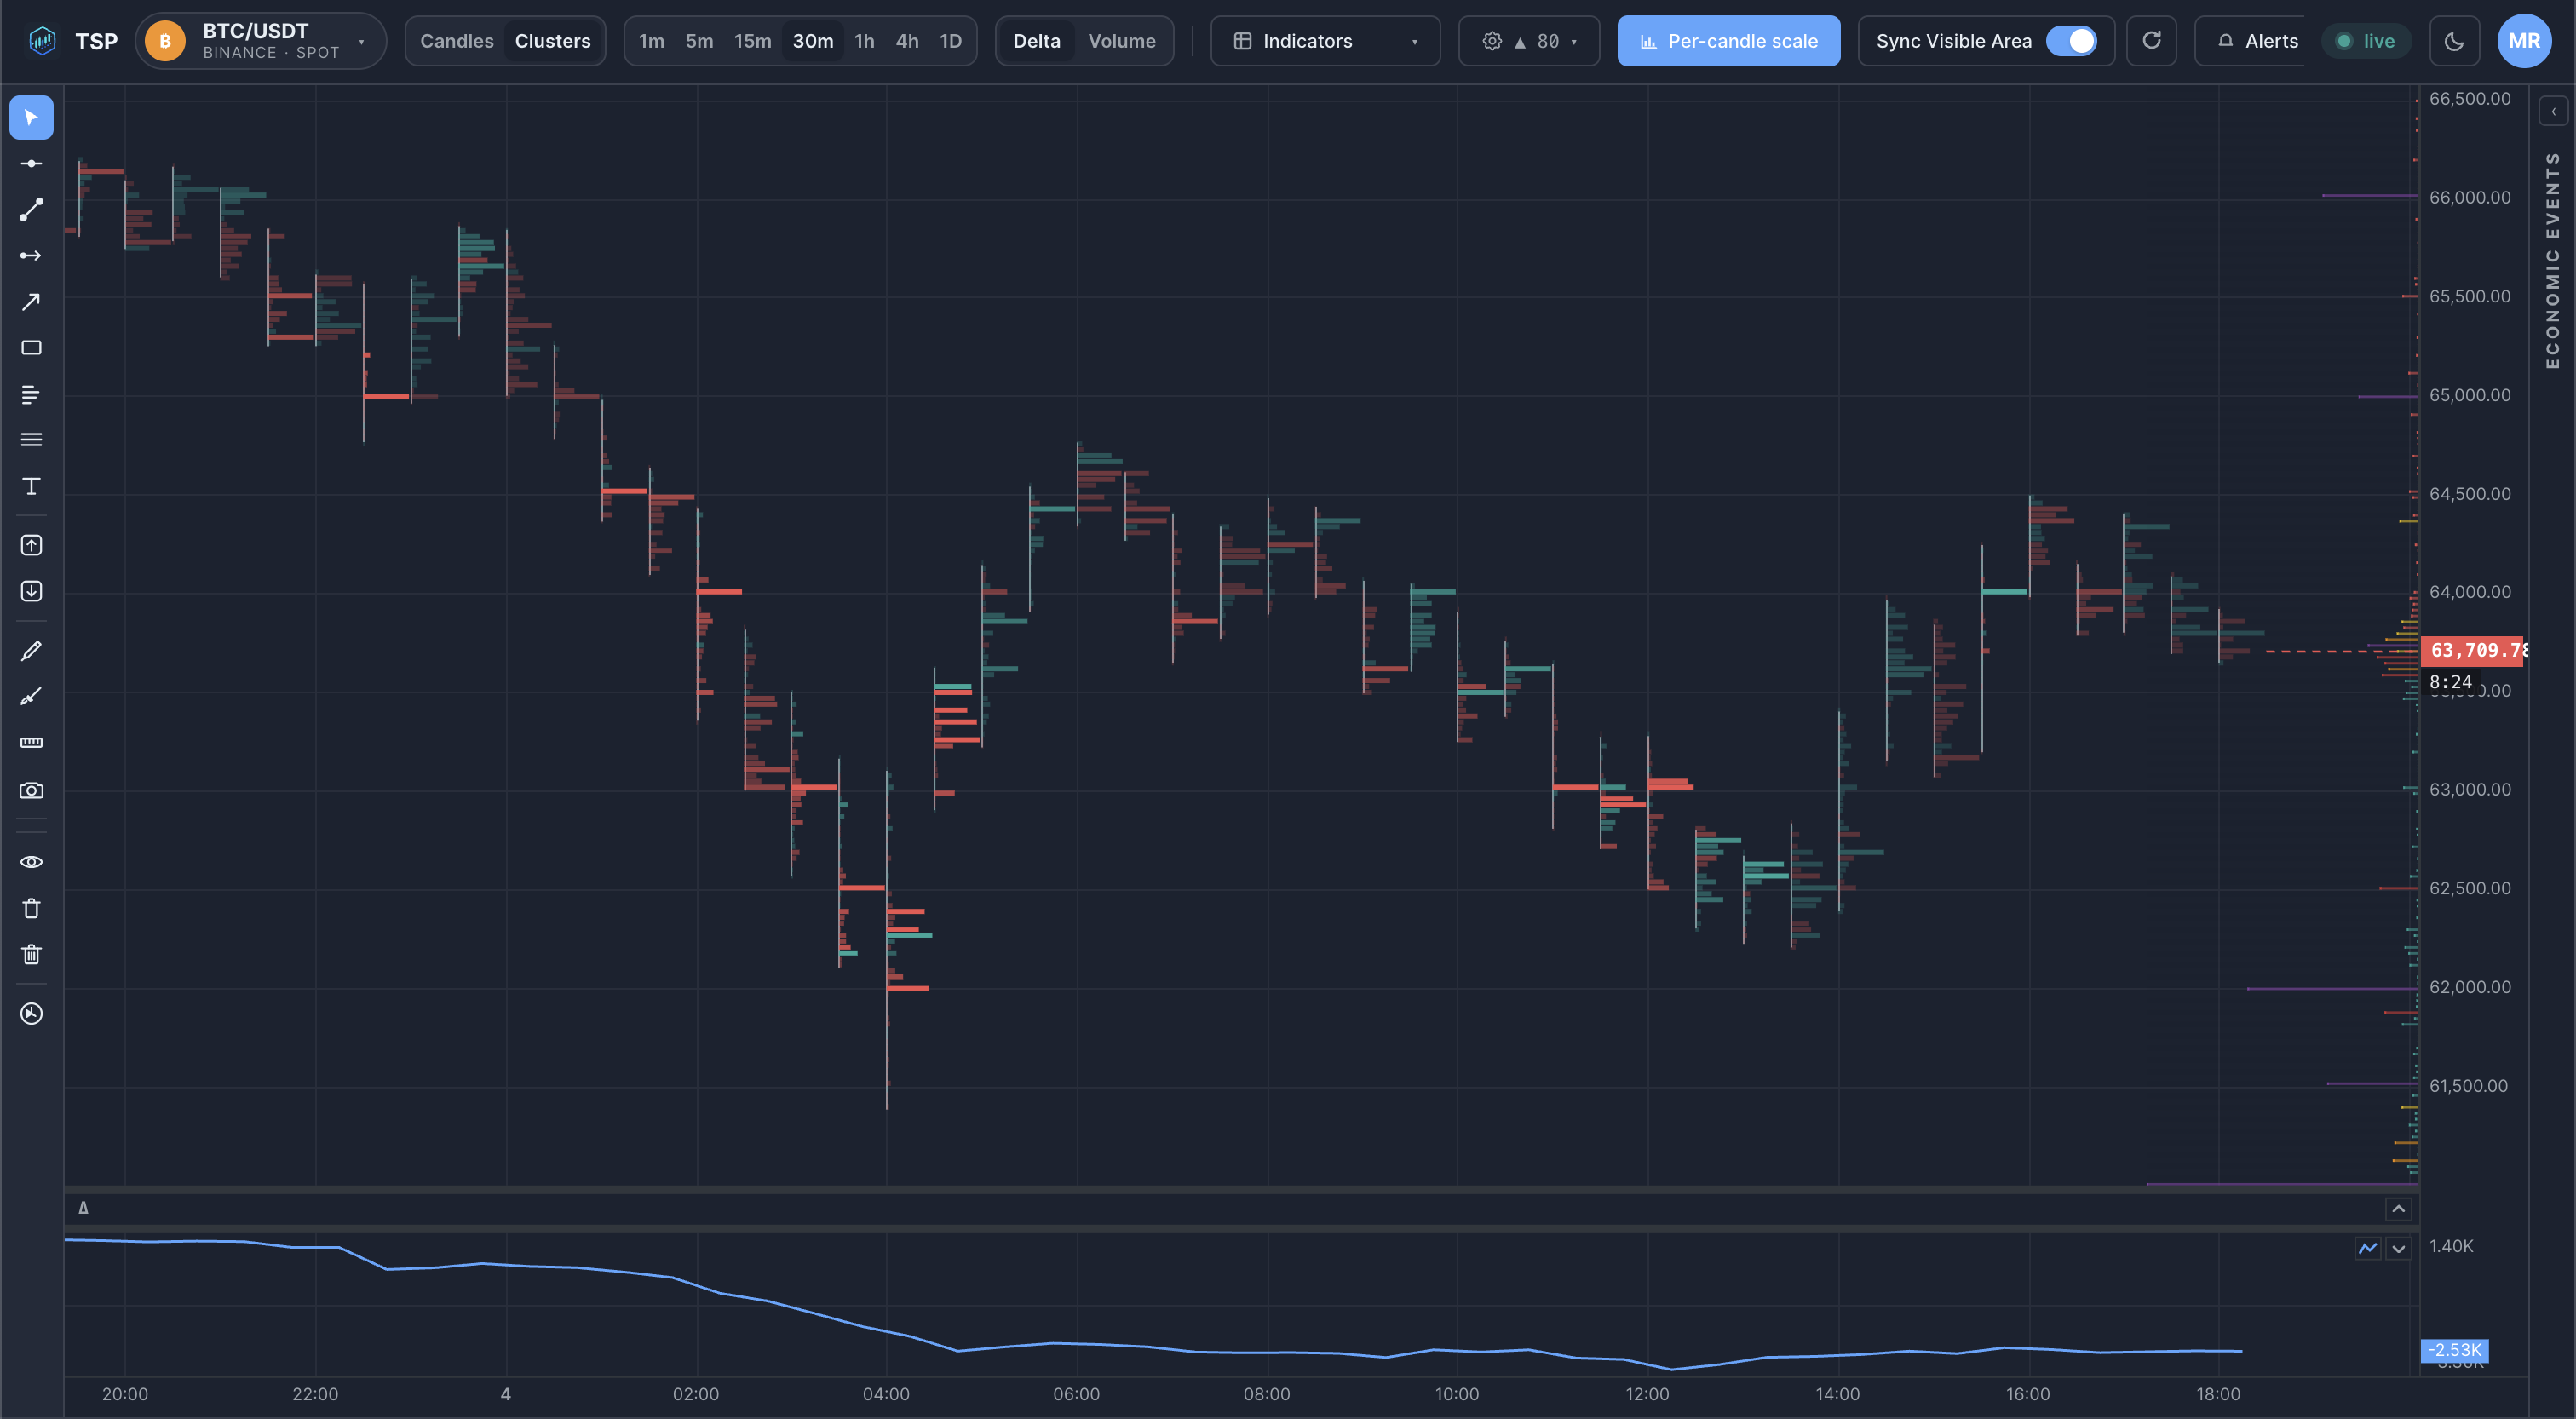
Example on a chart
Common mistakes
- Reading the absolute level. CVD's raw value depends entirely on its anchor; what matters is its slope and its relationship to price, not the number itself.
- Treating divergence as a reversal call. Divergence is descriptive context that aggression is changing — not a signal that price must turn.
- Comparing across different anchors. Two CVD lines started at different points are not directly comparable.
How TSP Core visualizes it
TSP Core plots cumulative delta as a line beneath the price chart, building it live from real-time delta as each bar forms. It sits next to the per-bar delta and footprint views, so you can move between the over-time picture and the bar- or level-detail behind it. The live CVD curve stays consistent with the delta values stored in history.
See live CVD on crypto markets
Open the TSP Core dashboard and watch cumulative delta build against price in real time.