Volume Analysis
Volume analysis is the study of how much trades, and where. It looks at traded participation behind a price move and at how that activity is distributed across price and time — context that price alone leaves out.
What is volume analysis?
Volume is simply the quantity that changed hands in a period or at a price. Volume analysis asks what that quantity tells you: was a move backed by broad participation or carried on thin activity? Did volume cluster at one price or spread across a range? It spans several lenses — volume per bar, volume by price (a profile), and volume split by aggressor side (delta) — but the common thread is using how much traded to add meaning to where price went.
Why does it matter?
Identical-looking moves can rest on very different participation. Volume analysis surfaces that difference:
- Conviction vs. drift — a move on heavy volume reflects broad participation; the same move on light volume traded thinly.
- Where price spent effort — prices that traded large volume often become reference levels later.
- Change in tempo — rising or fading volume as price approaches a level is descriptive context about participation.
These are descriptive observations about activity, not predictions or recommendations.
How traders use it
- Comparing the volume of a breakout bar against the bars around it to judge participation.
- Using a volume profile to find the prices that traded the most over a chosen range.
- Pairing volume with delta to separate "a lot traded here" from "one side was the aggressor here".
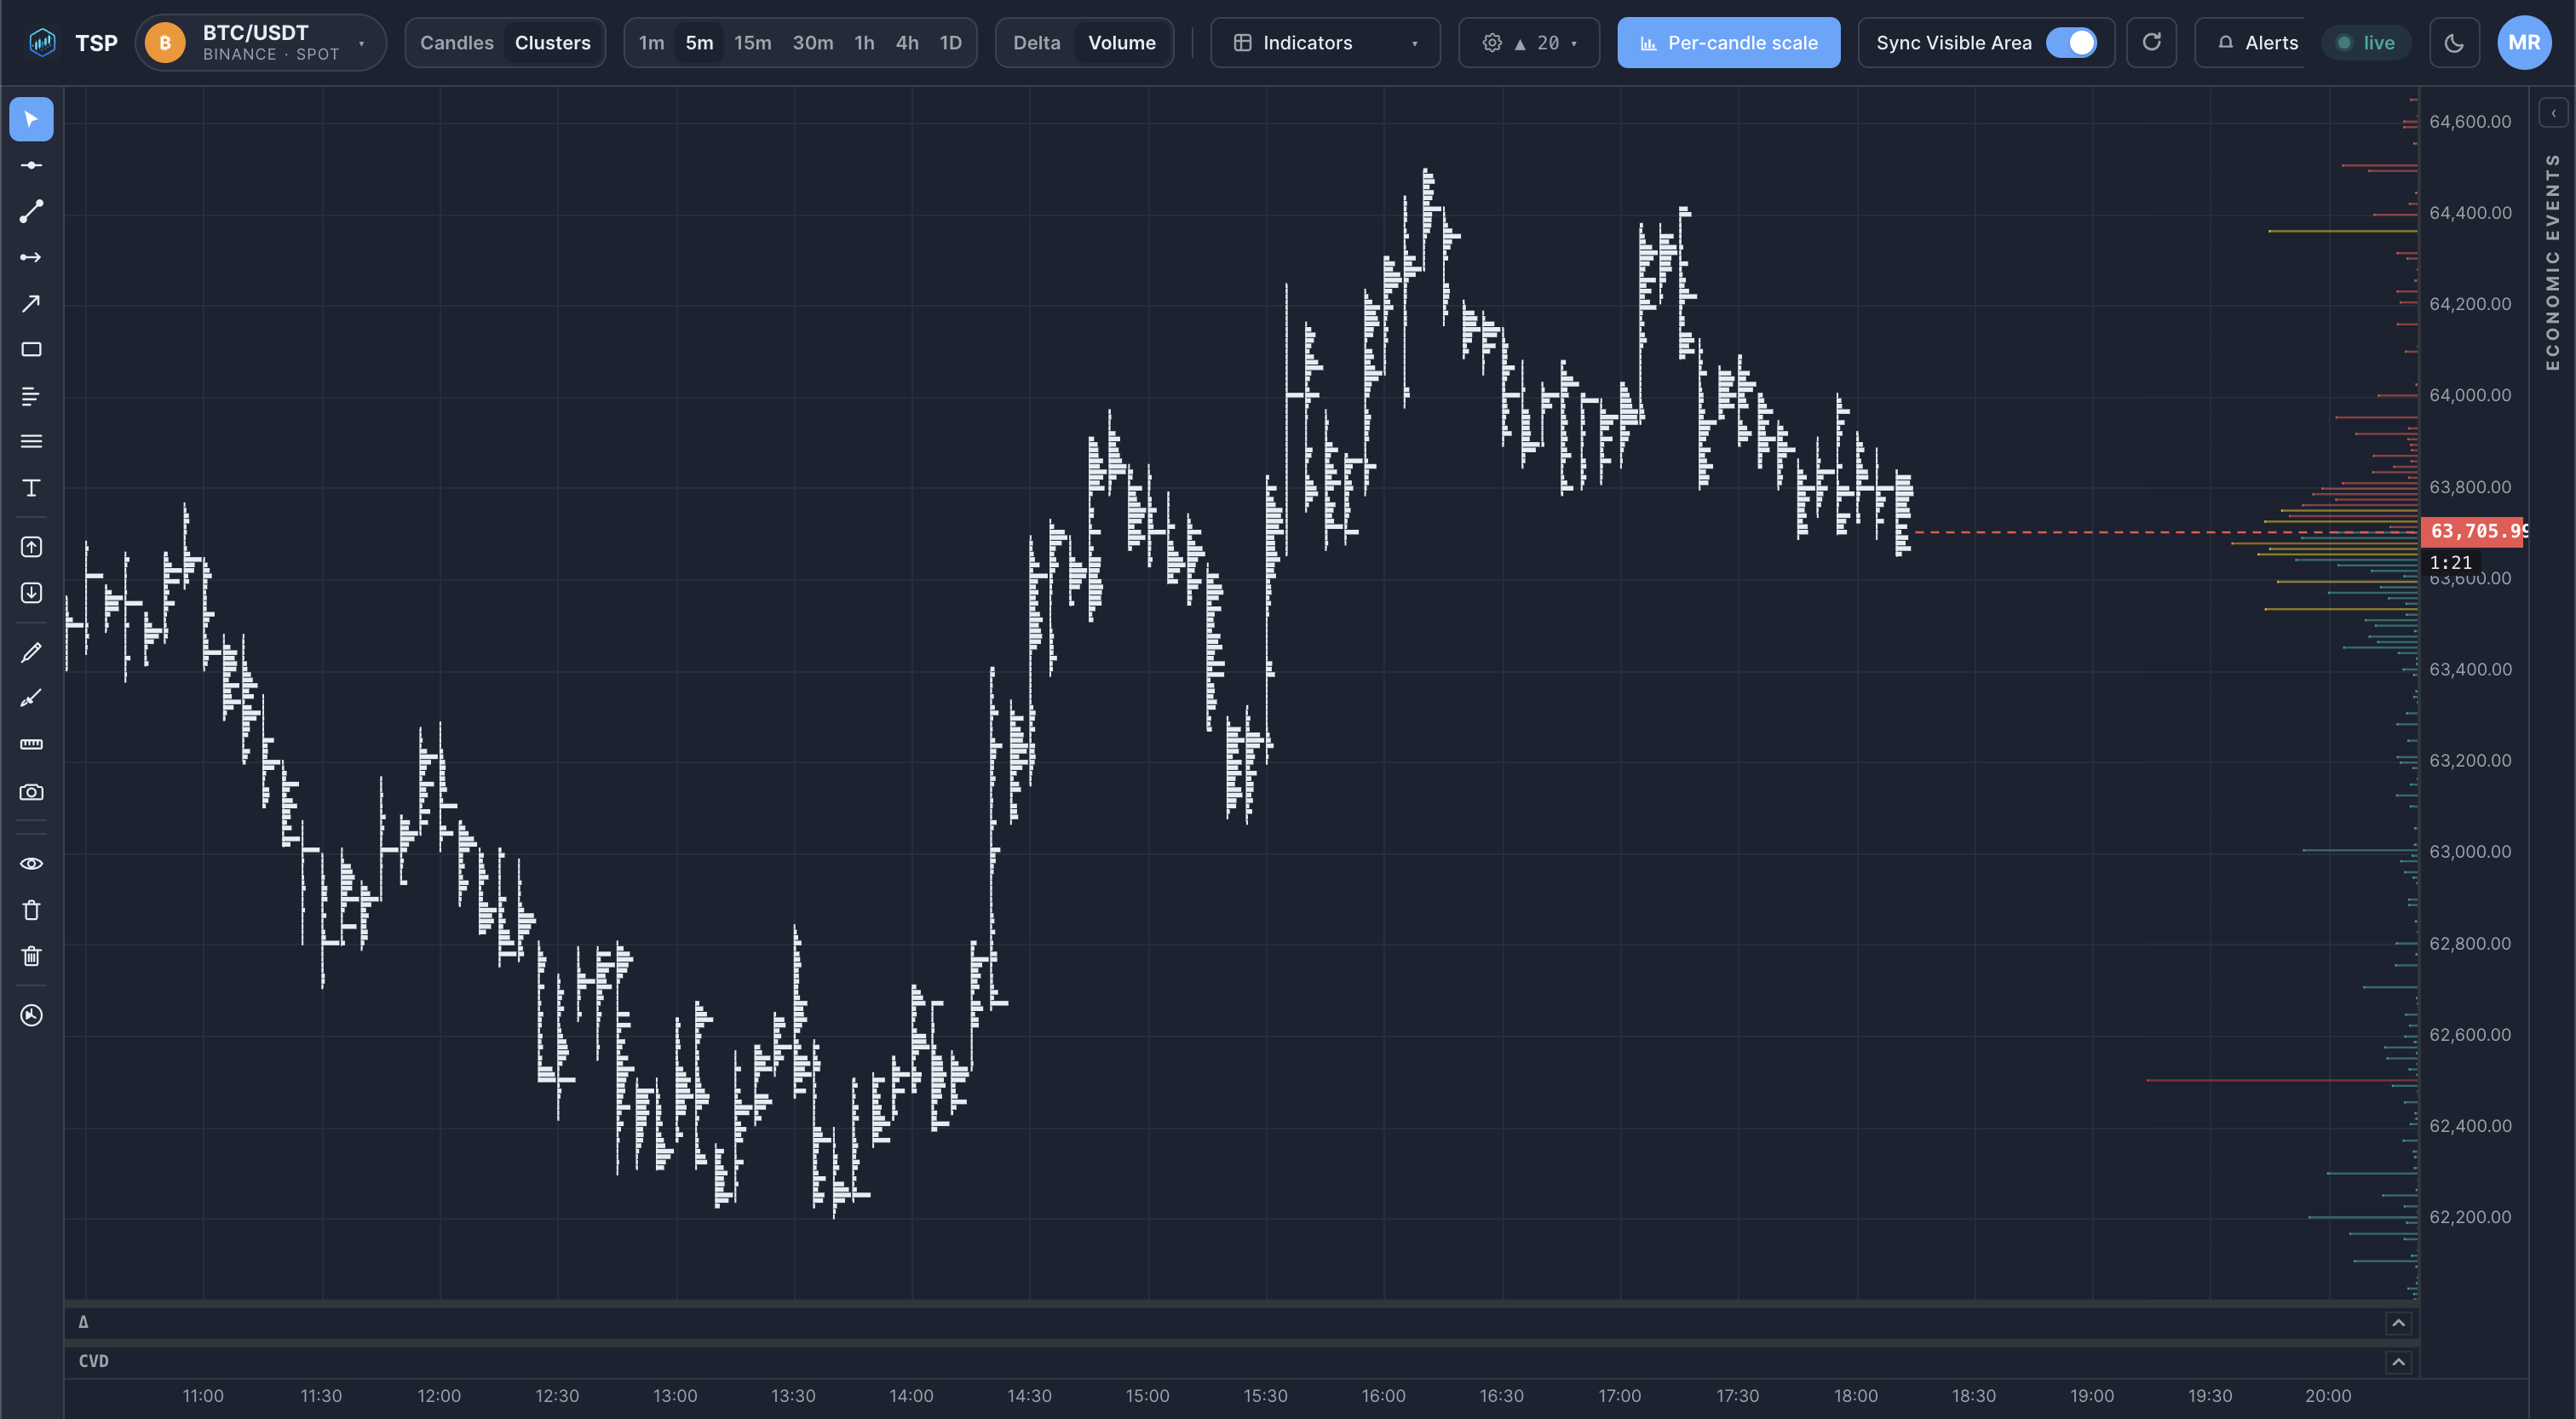
Example on a chart
Common mistakes
- Treating high volume as bullish or bearish on its own. Volume says how much traded, not which side won — read it with delta for direction of aggression.
- Comparing volume across different sessions blindly. Quiet hours and active hours have very different baselines; compare like with like.
- Ignoring where the volume sat. The same total volume means different things if it pooled at one price versus spreading across the range.
How TSP Core visualizes it
TSP Core presents volume in several connected forms from the same live data: per-bar volume under the price chart, volume-by-price as a profile, and volume inside each bar as footprint and cluster columns. You can move between a time view and a price view of the same activity, with the most active areas emphasised so distribution is easy to read.
See live volume on crypto markets
Open the TSP Core dashboard and read volume by time and by price in one workspace.