Volume Profile
A volume profile is a horizontal histogram of traded volume by price over a chosen range. Instead of asking when volume happened, it asks at what price — revealing the levels that the market traded most heavily.
What is a volume profile?
Pick a range — a session, a day, a swing, or an arbitrary selection — and total the volume that traded at each price within it. Plot those totals sideways and you get a profile: long bars at prices that traded a lot, short bars where price passed through quickly. Three landmarks fall out of it:
- Point of Control (POC) — the single price that traded the most volume; the profile's peak.
- Value Area — the price band containing the bulk of the volume, commonly about 70%.
- Low-volume nodes — thin areas the market moved through without trading much.
Why does it matter?
A volume profile reframes the chart around price acceptance rather than time:
- High-volume prices mark areas the market spent effort trading — often referenced again later.
- The value area describes the range where most business was done over the period.
- Low-volume gaps show prices that were rejected quickly the last time through.
These are descriptive observations about where volume traded — context for self-directed analysis, not predictions or recommendations.
How traders use it
- Drawing a profile over the prior session or day to find its POC and value-area edges.
- Watching how price behaves when it returns to a high-volume price versus a low-volume gap.
- Anchoring a profile to a specific event or swing to study acceptance since that point.
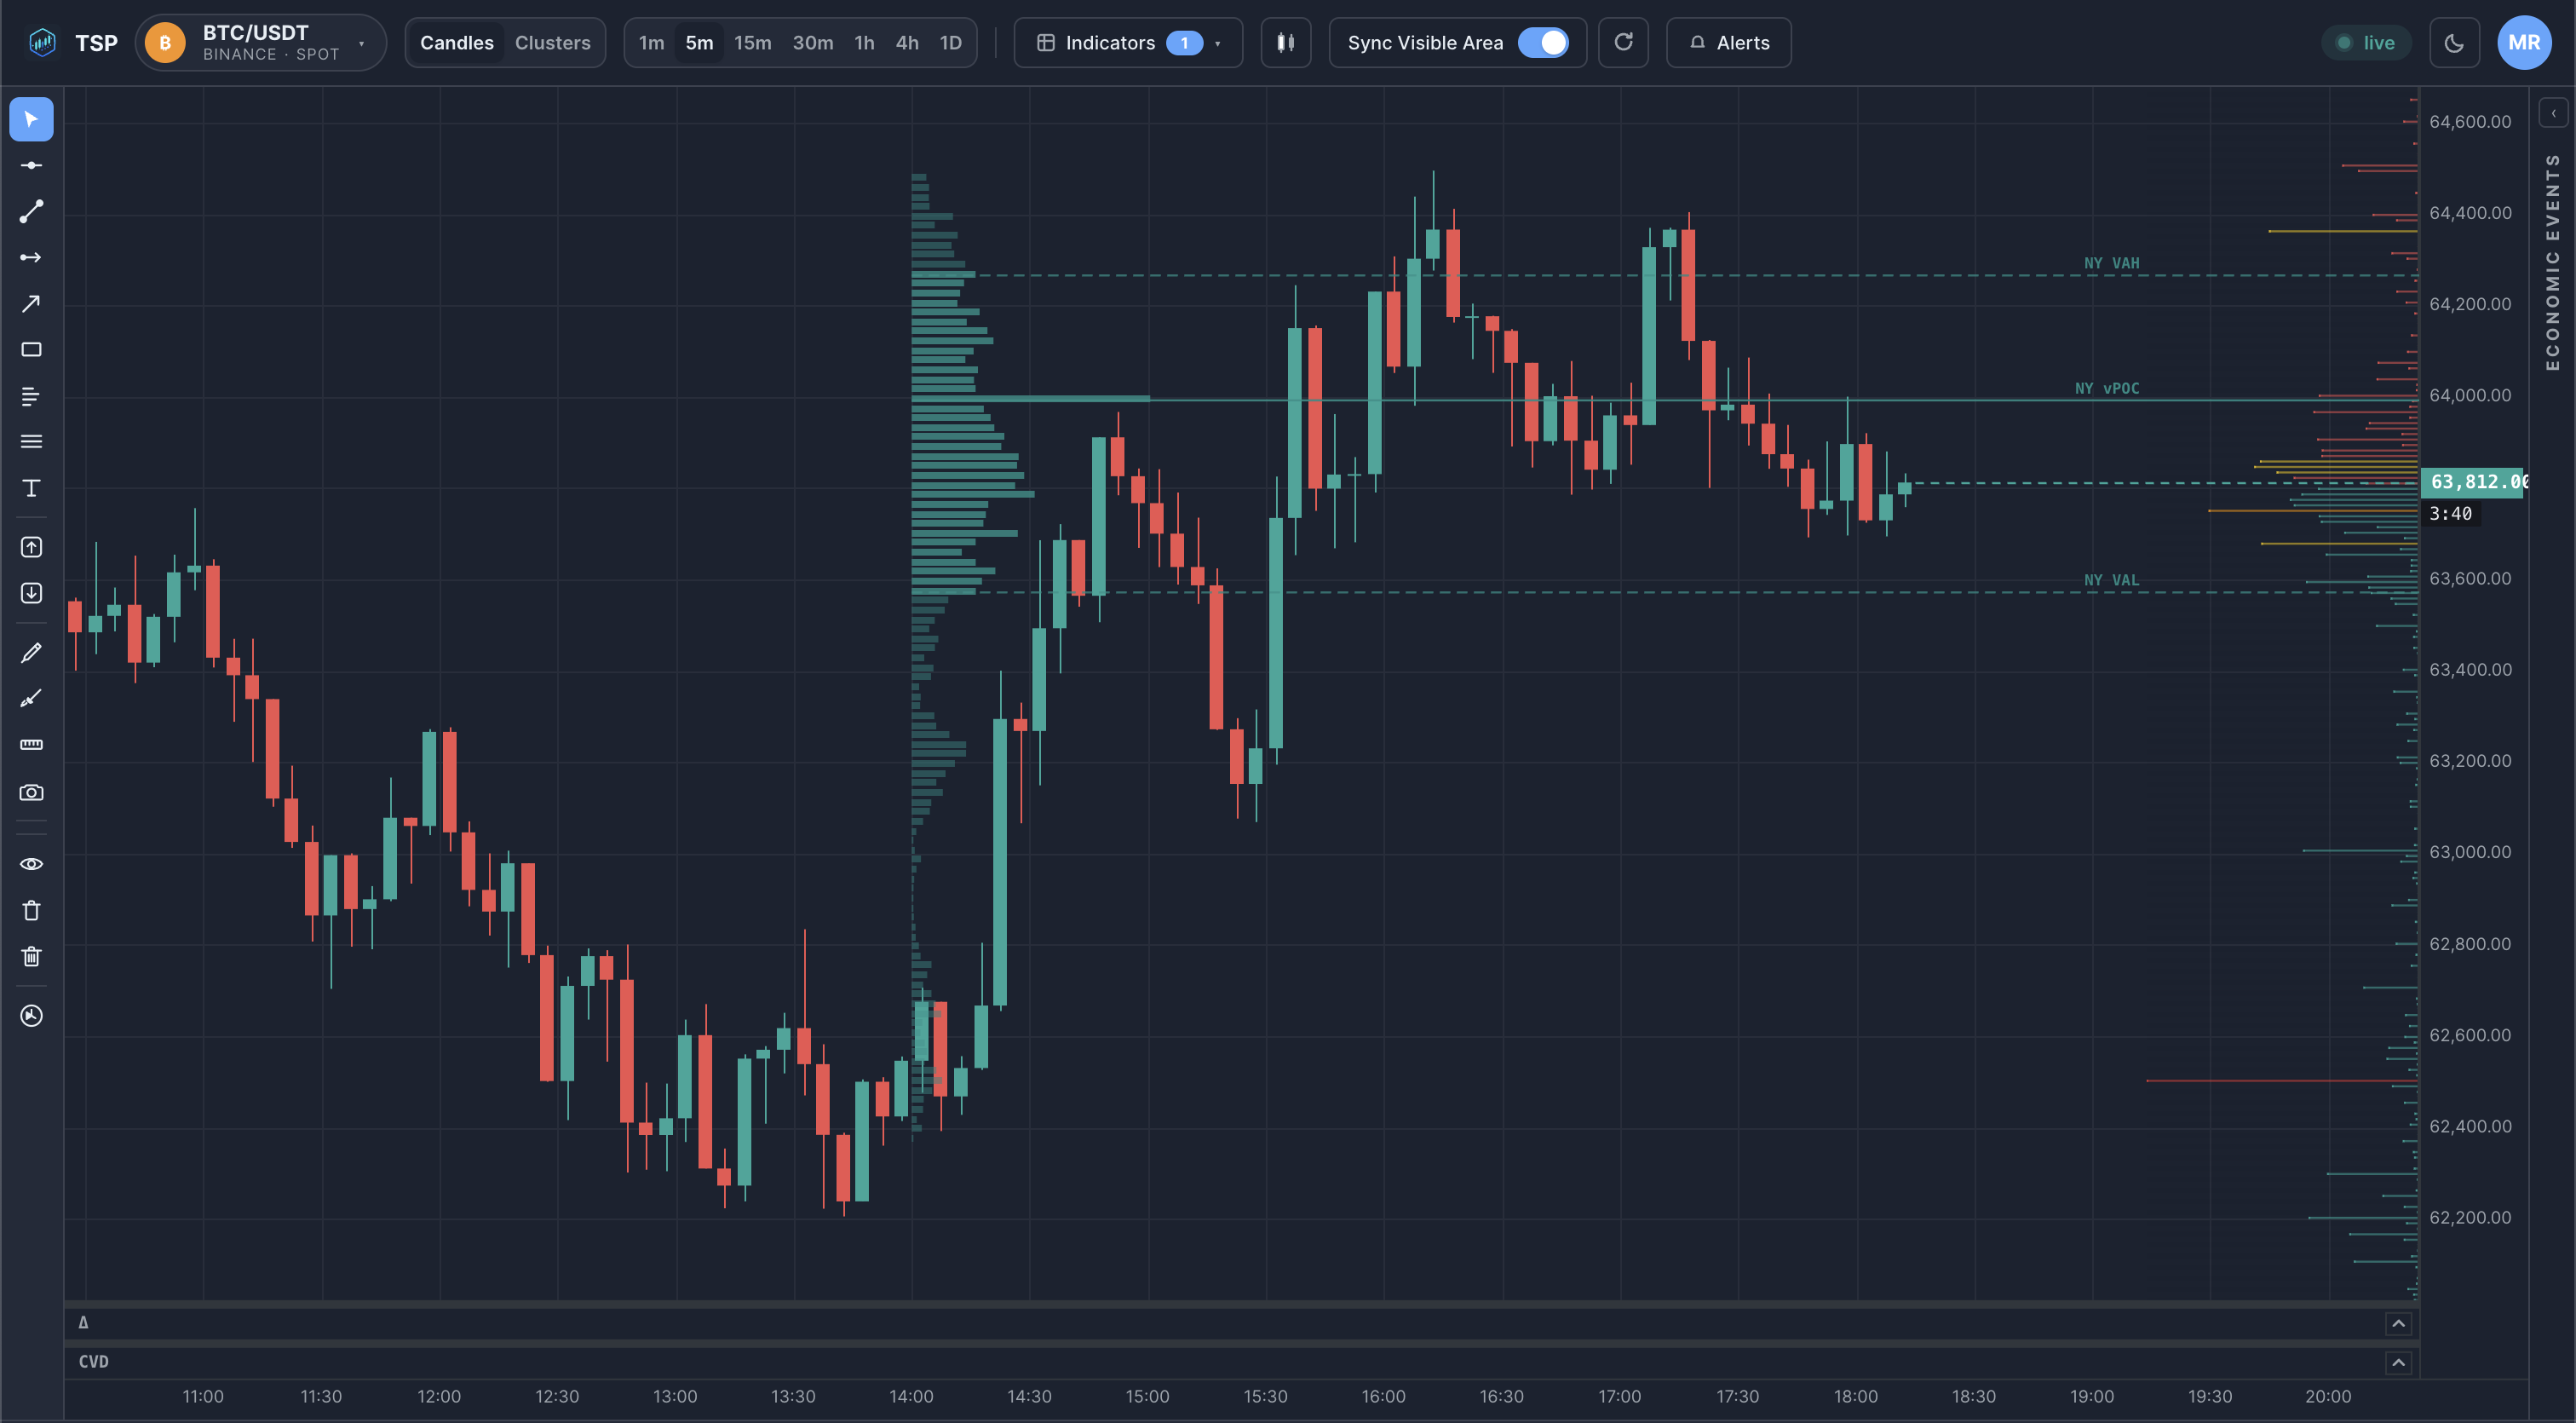
Example on a chart
Common mistakes
- Treating the POC as a guaranteed magnet or wall. It marks where volume traded; how price reacts there is context, not a certainty.
- Choosing an arbitrary range. A profile only means something over a deliberate range — a session, a swing, an event — not a random window.
- Confusing it with a time-based volume bar. A volume profile is volume by price; the histogram under the chart is volume by time. They answer different questions.
How TSP Core visualizes it
TSP Core builds volume profiles over any range you select and overlays them on the price chart, marking the point of control and value-area bounds. Profiles are computed from the same historical and live data behind the rest of the workspace, so the levels you read line up with the footprint, cluster and session views beside them.
See volume profiles on live crypto data
Open the TSP Core dashboard and draw volume-by-price profiles over any range.